Algorithm suite

RailDB provides an algorithm suite for common analyses:

  • Rail grinding planning
  • Rail milling planning
  • Rail replacement planning
  • Geometry safety assessment
  • Geometry temping planning
  • Geometry predictions
  • Rail wear predictions
  • etc.

The Python based algorithms provide an automated assessment of data resulting in reports for the end-user. The relevant data is queried from the datawarehouse and subsequently assessed by a deterministic rule-base that can be understood by the users. Neural nets are not applied in these algorithms. The results are location lists, reports and geospatial maps for follow-up maintenance planning by the end user.

Algorithm output

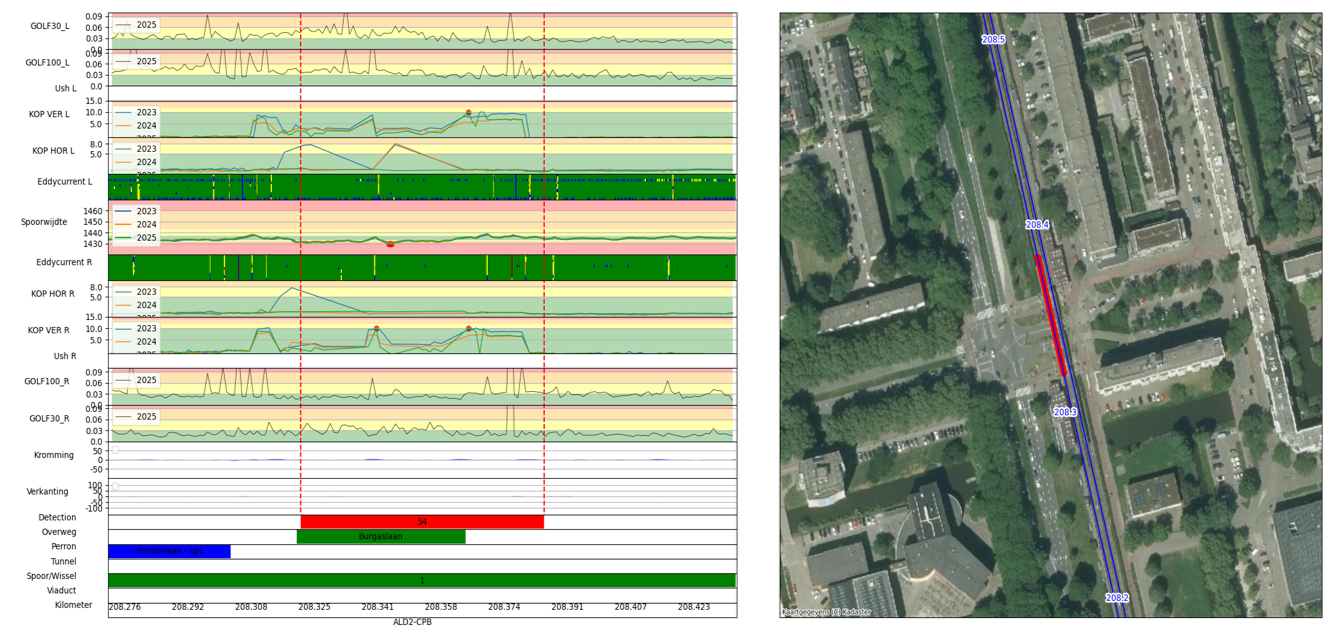
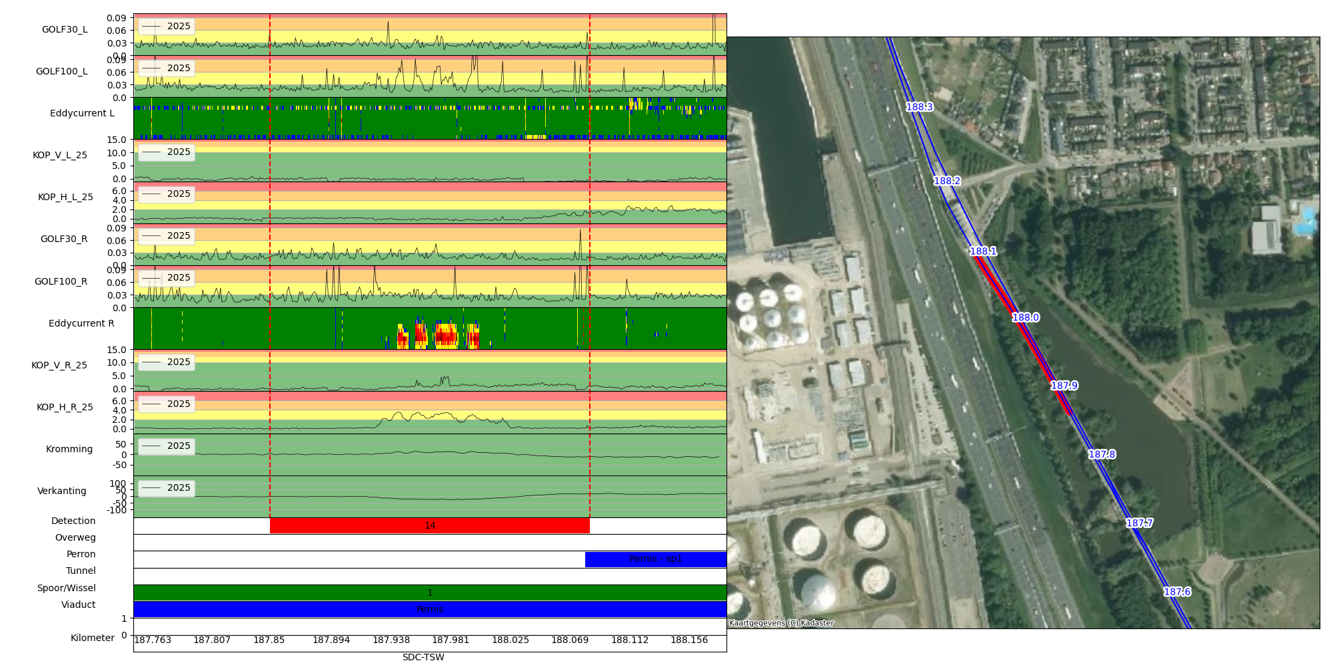
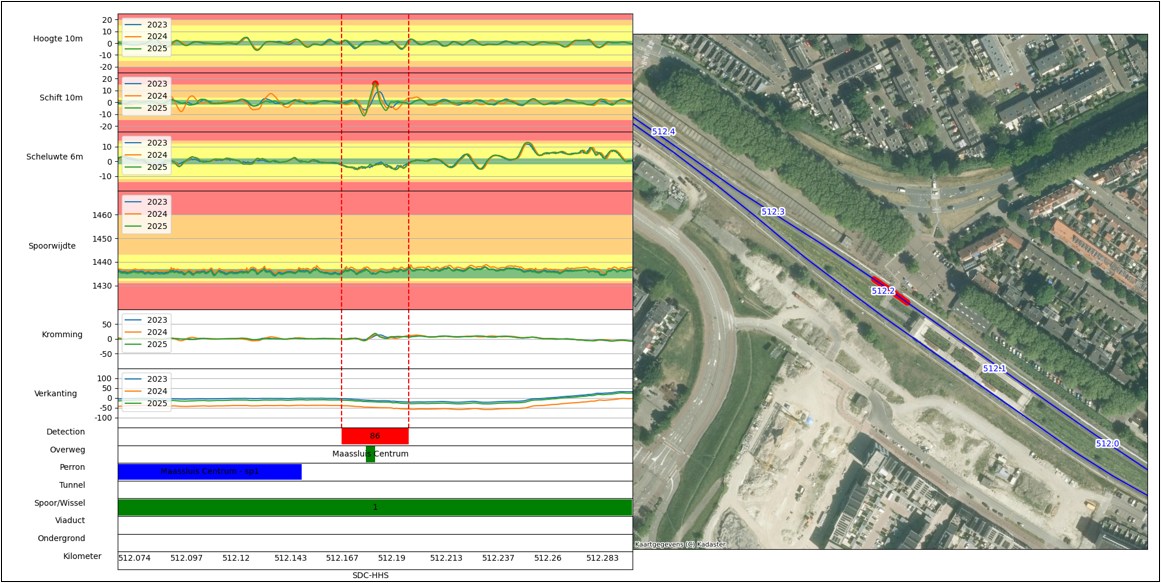
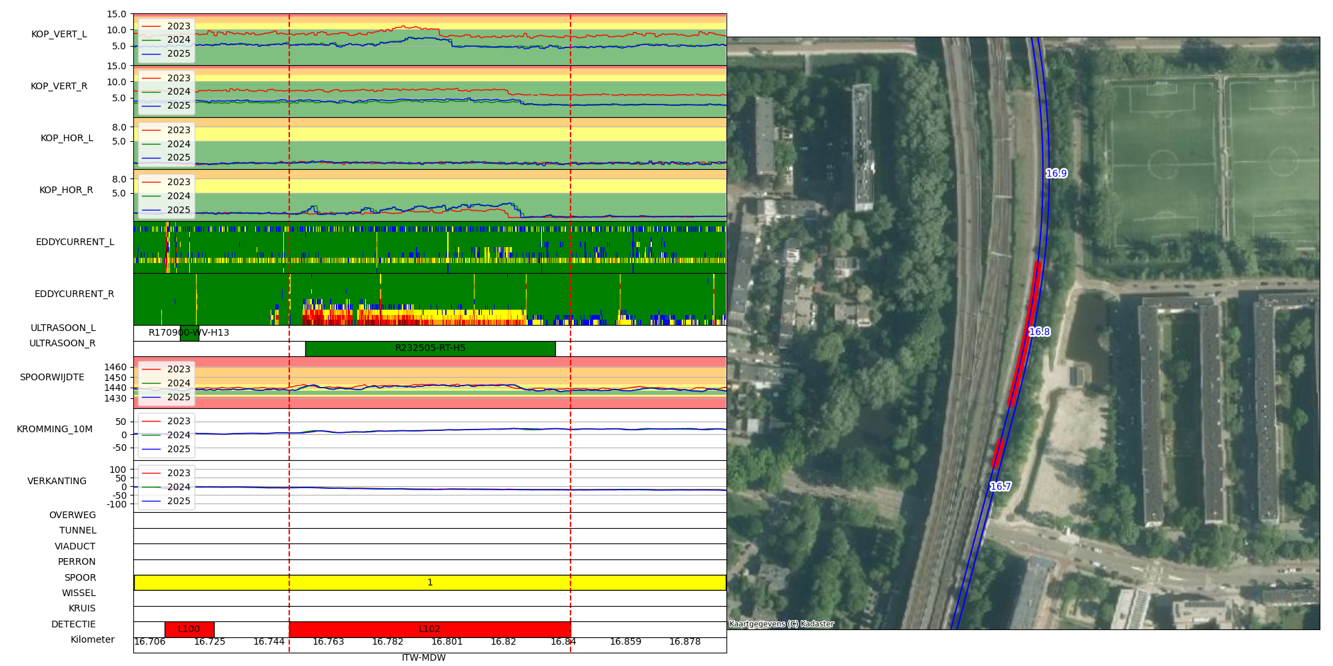
The output of algorithms is often a simple list of what we call “detection locations”. At these locations something relevant happens like a safety norm is exceeded, a trendbreak occurs or some threshold is surpassed. For each detection location an image is generated with all relevant data. These images can be quickly assessed by us or by an analyst. Shown here are some examples of detection locations for all kinds of different algorithms we use. The results including the list of detection locations, the location images and our prioritization of the locations can be accessed through the RailDB API, standard reports and/or the mapservices.

Manual assessment

The algorithms provide the heavy lifting by executing the bulk analysis. The final step of prioritizing the resulting maintenance locations must be done by a human analyst but this requires only a fraction of the time compared to a complete manual analysis. This way, the analyst can focus on assessing the suspicious problem locations instead of finding them in the first place. We provide a first prioritization of the detected locations as a service. So the algorithm suite comes close to “Assetmanagement As A Service”.